 LoginSchedule demoLoginSchedule demo
Share counts do not prove value. Here is the framework for proving what employee advocacy actually returns: incremental reach, EMV, and pipeline influence.

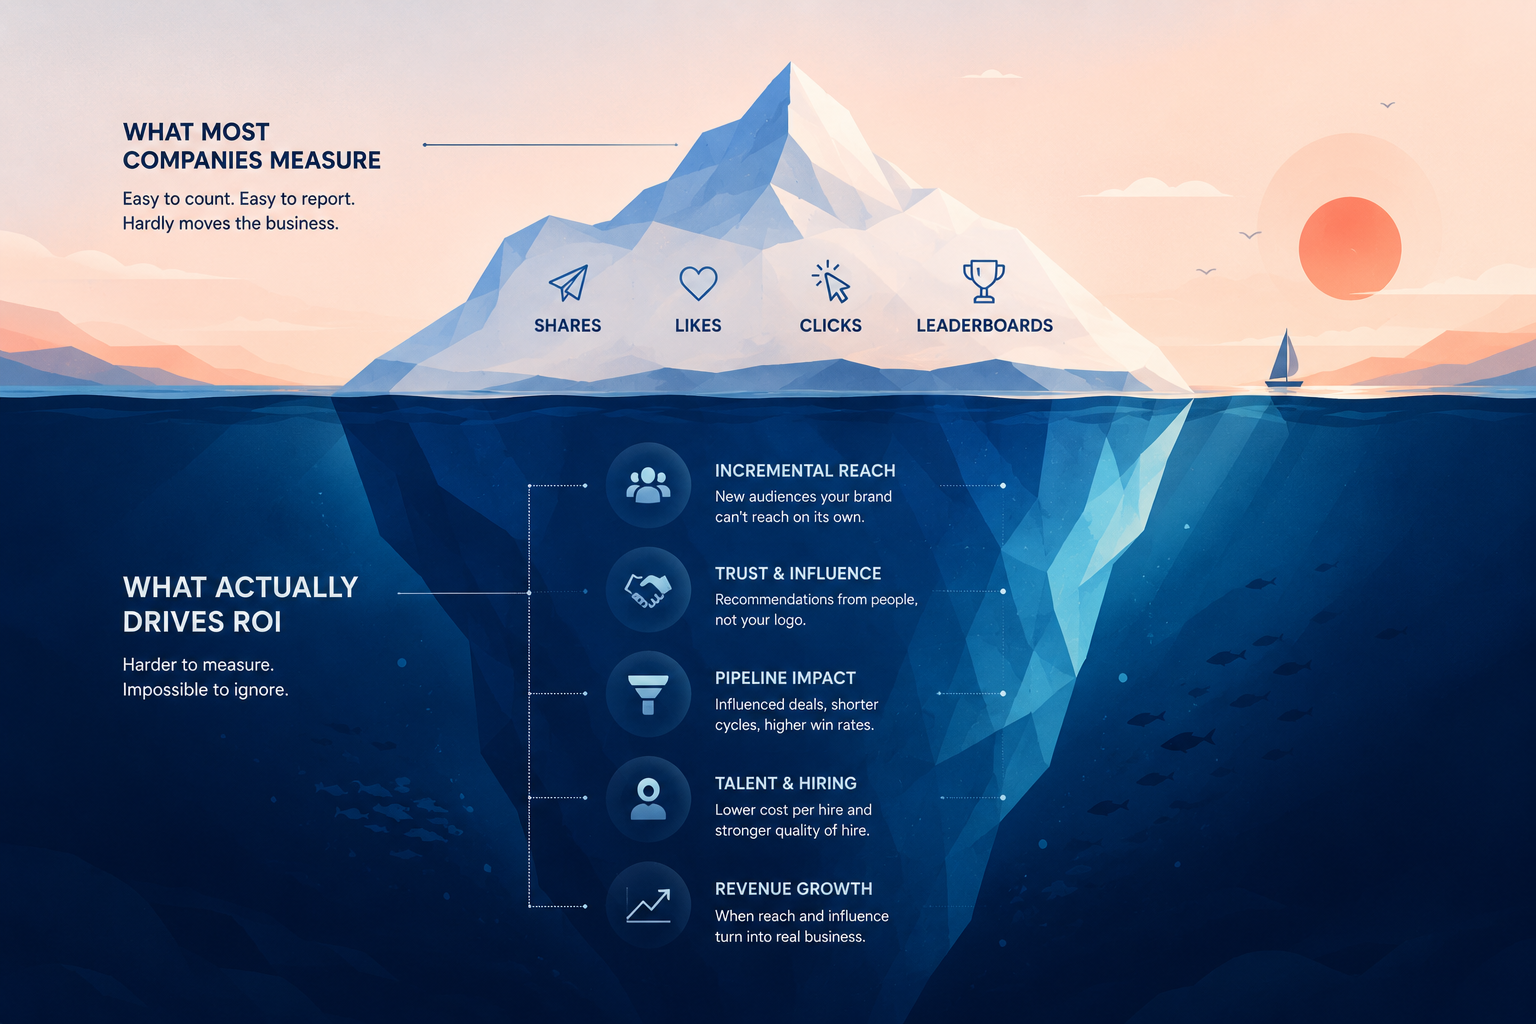
Employee advocacy ROI is measured across three layers: activity (is the program running?), audience (are you reaching people you couldn’t otherwise reach?), and outcome (did it affect pipeline, sales cycles, or hiring costs?). Most programs stall at the first layer, counting shares, clicks, and leaderboard points, and then wonder why finance doesn’t believe the numbers. Activity metrics describe effort. They don’t describe return. The return lives in the second and third layers: incremental reach your brand channels can’t buy, and the business outcomes that reach influences. This post walks through all three layers, gives you real benchmarks from enterprise advocacy programs, and shows the arithmetic for calculating earned media value, including where that arithmetic breaks down.
Employee advocacy doesn’t have a measurement problem. It has a measurement inheritance problem.
The first generation of advocacy tools was built around gamification: points for sharing, leaderboards for the most active users, badges for streaks. Those mechanics needed something to count, so the platforms counted what was easy. Shares, clicks, participation rates. A generation of program owners learned to report those numbers because those were the numbers on the dashboard.
Here’s the issue: every one of those metrics can go up while value stays flat. A program can hit 80% participation and return nothing. If a hundred employees share the same post to audiences who already follow your brand page, you’ve generated a hundred data points and close to zero new reach. The dashboard looks great. The business case doesn’t exist.
I’ve sat in enough renewal conversations to know how this ends. The program owner presents share volume, the CFO asks “so what did that get us,” and nobody has an answer that survives the follow-up question. That’s not a failure of advocacy. Employee advocacy is one of the few channels where reach compounds instead of decaying. It’s a failure of measuring the wrong layer.
Every metric your program can produce answers one of three questions:
| Layer | Question it answers | Example metrics |
|---|---|---|
| Activity | Is the program running? | Shares, participation rate, active users |
| Audience | Are we reaching people we couldn’t otherwise reach? | Incremental reach, network overlap, EMV |
| Outcome | Did it affect the business? | Pipeline influence, sales cycle, cost per hire |
The layers build on each other. You can’t have audience without activity, and you can’t have outcomes without audience. But here’s the part legacy dashboards get backwards: only the second and third layers are evidence of return.
Activity metrics are your program’s vital signs: registered users, monthly active users, sharer counts, content adoption. Track them. When participation drops, something upstream is broken (stale content, a champion who left, an onboarding gap), and activity metrics are how you catch it early.
Just be honest about what they are: diagnostics, not results. Participation rate tells you whether the engine is turning over. It says nothing about whether the car is moving. When you report activity metrics as ROI, you teach leadership that advocacy is a vanity channel. You also make the eventual budget conversation harder, because you’ve spent quarters anchoring them on numbers that don’t connect to anything they care about.
Most programs stop here. It’s the single most common reason advocacy gets cut.
The question that separates advocacy from every other channel: are you reaching people your brand could not otherwise reach?
Your brand page reaches your followers, minus whatever the algorithm withholds. Paid reaches whoever you can afford this quarter, and stops the moment you stop paying. Your employees’ networks are different in kind. They’re made up of former colleagues, classmates, customers, and industry peers who chose to connect with a person, and a large share of them have no relationship with your brand at all.
That’s incremental reach: audience that is additive to your brand channels rather than duplicative of them. It’s the metric that turns advocacy from “amplification,” a nice-to-have echo of the brand account, into a distribution channel in its own right.
We tested this against engagement data from two enterprise programs on the platform. One had 145 employees sharing over a full year; the other had more than 3,000 sharers across a recent quarter, with over 83,000 unique engaged professionals between them. The pattern held in both. Between 81% and 86% of the people who engaged did so with exactly one employee’s content. They never touched another colleague’s shares in the period. And comparing top sharers’ engaged audiences pair by pair, the average overlap between any two employees’ audiences was under 2% in the smaller program, and under 0.5% in the larger one. For practical purposes, each employee’s engaged audience is theirs alone. Notably, overlap didn’t creep up as the program got twenty times bigger.
That is what “additive, not duplicative” looks like in the data. Every employee you activate brings an audience the rest of the program (and the brand account) was not reaching. No other channel has that property. Adding a second billboard, a second ad set, or a second post to the brand page reaches largely the same people again.
Zoom out to the broader platform picture and the reach itself is substantial. Across the enterprise programs we analyzed for this post (213 paying enterprise workspaces, trailing twelve months), the median program’s shares earned roughly 260 impressions each. Those are feeds an individual person put your content into, one trusted connection at a time. Top-quartile programs cleared 400 per share. No brand page algorithm change can take that away, because it doesn’t route through your brand page.
The common currency for this layer is earned media value (EMV): what you would have paid to buy equivalent impressions and engagement through ads. EMV is genuinely useful. It lets you put advocacy on the same slide as paid and compare cost per impression like-for-like. It is also a modeled figure, not revenue, and you should say so when you present it. An EMV number presented as if it were pipeline is exactly the kind of overclaim that made your marketing ops team skeptical of advocacy in the first place. Present it as “cost avoided versus equivalent paid distribution,” with your inputs visible, and it holds up. (Full worked example below.)
The third layer ties reach to business results: influenced pipeline, sales cycle length, win rates on advocacy-touched deals, and for the recruiting use case, cost per hire and source-of-hire shifts.
A word of honesty, because this is where advocacy reporting most often loses credibility: advocacy is almost never a last-click channel. A prospect sees your sales engineer’s post in March, downloads a report in May, and takes the demo in July from a paid retargeting ad. Last-click attribution hands that deal to paid. If you claim it entirely for advocacy instead, you’re making the same mistake in the other direction.
The defensible approach is influence, not attribution theater:
This layer takes longer to build than the other two. Start collecting the data now, report Layers 1 and 2 in the meantime, and be upfront with leadership about the timeline. “Influenced pipeline reporting lands in Q3” is a better answer than a number nobody trusts.
Benchmarks in this category are usually either invented or so aggregated they’re useless. These come from EveryoneSocial platform data: 213 enterprise workspaces on paid plans with at least 25 registered users, covering the trailing twelve months (June 2025 to May 2026). “Typical” is the median; “strong” is the top quartile.
| Metric | Typical | Strong |
|---|---|---|
| Monthly active users (% of registered) | ~50% | 70%+ |
| Monthly sharers (% of registered) | ~14% | 26%+ |
| Engagements per share | ~4 | 6+ |
| Clicks per share | ~1.3 | 2+ |
| Impressions per share | ~260 | 400+ |
Three notes on reading this table honestly:
Here’s the arithmetic, using the median benchmarks above for a mid-sized program. Swap in your own numbers, especially your own CPM, pulled from your actual ad account rather than an industry average.
The formula:
EMV = (Total impressions ÷ 1,000 × your paid CPM) + (Total clicks × your paid CPC) + (Total engagements × your paid CPE)
One thing worth knowing before you present this to anyone: there is no industry-standard EMV formula. You’ll find reach-only models (impressions × CPM), engagement-only models that assign a dollar value per interaction, and fuller models that price each result the way an ad platform would. The formula above is the full version: it values visibility, action, and interaction separately, which matters for advocacy specifically, because clicks and engagement are where employee shares outperform brand content. Whichever model you use, disclose it and stick with it. EMV is comparable over time within one methodology, not across tools or vendors.
Worked example. Say your program has 1,000 registered users. At the median sharer rate (14%), about 140 people share in a given month. If each sharer averages 4 shares, that’s 560 shares monthly. The rates below are published 2025-to-2026 LinkedIn B2B benchmarks; swap in your own.
The caveats, stated plainly, because they’re what make the number defensible:
Measure across three layers: activity (shares, active users) to confirm the program is running; audience (incremental reach, earned media value) to prove you’re reaching people your brand channels can’t; and outcomes (influenced pipeline, sales cycle, cost per hire) to connect that reach to business results. Only the second and third layers are evidence of return.
The same three-layer framework applies: track sharing activity for program health, then measure whether advocate networks reach audiences your owned channels don’t, then connect that reach to conversions, pipeline, or hiring outcomes. The distinguishing metric is incremental reach, meaning audience that is additive to your brand’s rather than duplicative of it.
In EveryoneSocial enterprise platform data, the median program sees about half of registered users active monthly, with roughly 14% sharing in a given month; top-quartile programs see 26%+ monthly sharers. Treat participation as a health indicator, not a result. A program’s value lives in reach and outcomes, not activity.
Track activity metrics (registered users, monthly actives, sharer rate) as diagnostics; audience metrics (impressions per share, incremental reach, earned media value) as your core value story; and outcome metrics (advocacy-influenced pipeline, cycle length on touched deals, cost per hire) as your executive reporting. Report each layer as what it is, and don’t present activity as return.
Earned media value (EMV) estimates what you would have paid to buy the impressions, clicks, and engagement your employees’ shares generated organically, priced at your own paid CPM, CPC, and cost-per-engagement. It’s a modeled cost-avoidance figure, not revenue. It’s useful for comparing advocacy against paid distribution, as long as you present the inputs.
Review activity metrics monthly to catch program-health issues early, but report value on a trailing-twelve-month basis. Advocacy compounds, since networks grow and sharing habits build over quarters, so quarter-over-quarter snapshots systematically understate a maturing program. Set that expectation with leadership at kickoff, not at renewal.
The three layers, the benchmarks, the EMV math: all of it exists to answer one question your leadership is already asking. What did advocacy get us that we couldn’t have gotten anyway? If you’d rather answer with your own numbers than benchmarks, get a demo and we’ll show you the audience layer live.
See the platform that comms, marketing, and compliance teams use to run their advocacy program.


